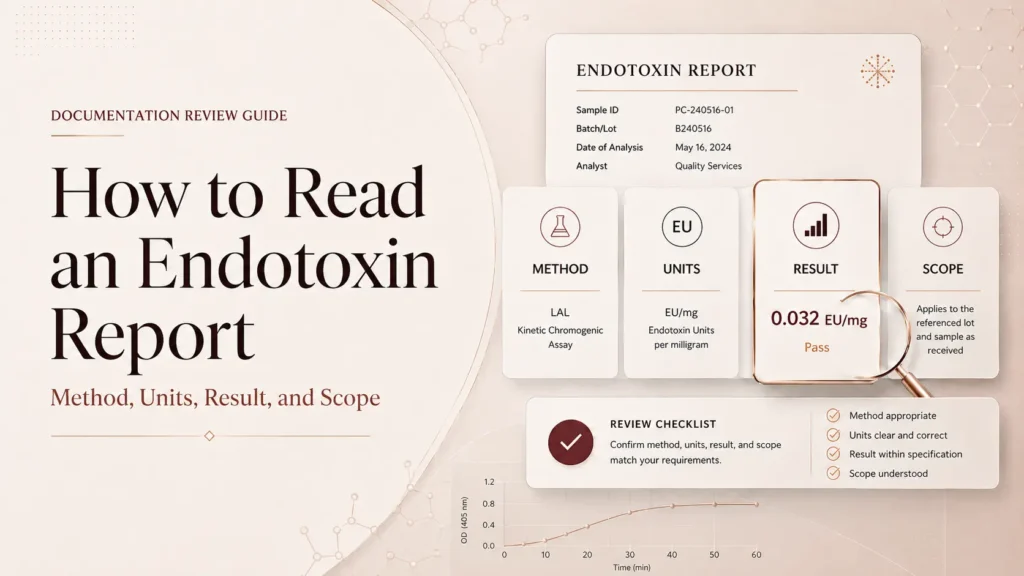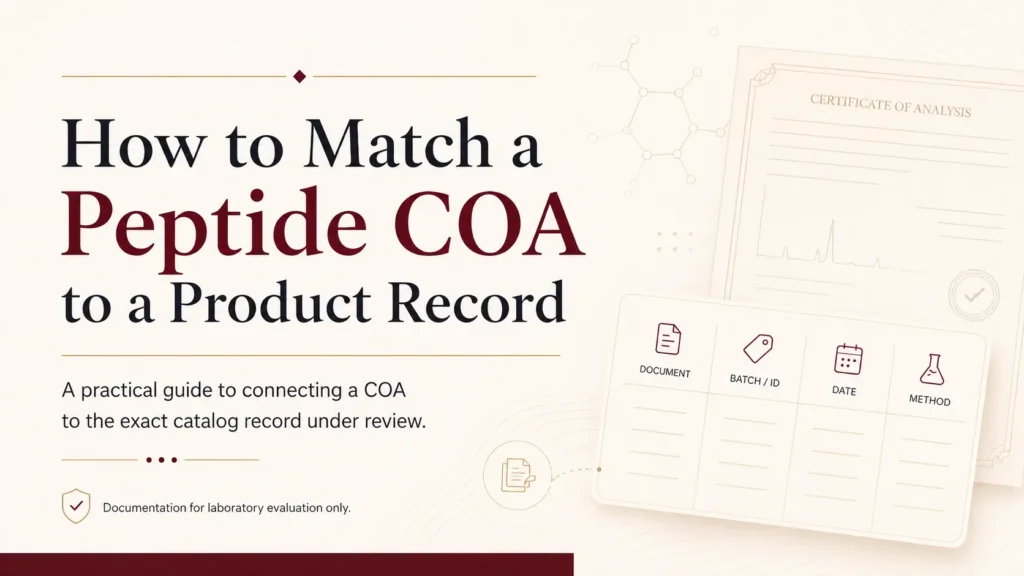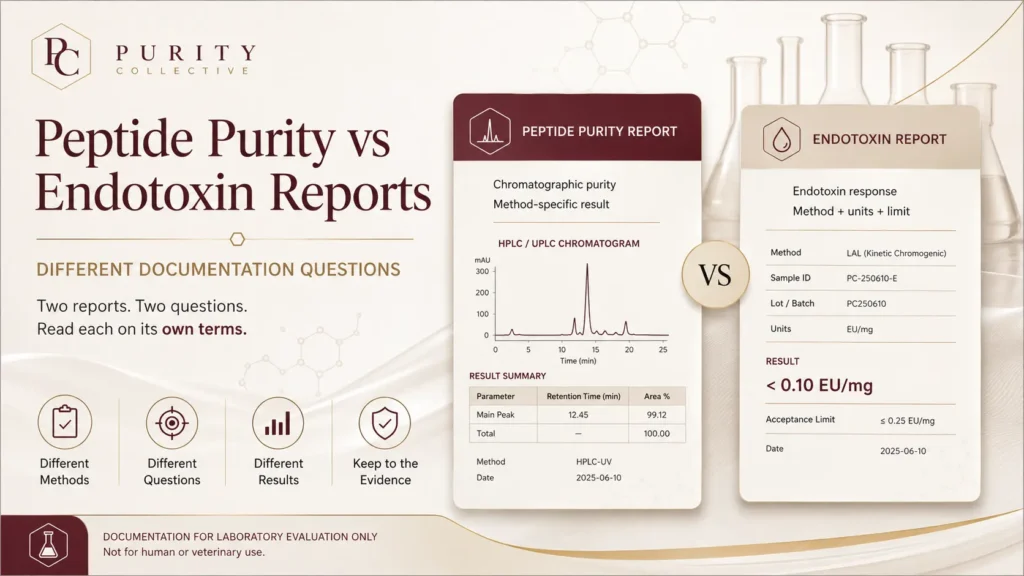

A 99% chromatogram and a mass spectrum can both look reassuring. They answer different questions.
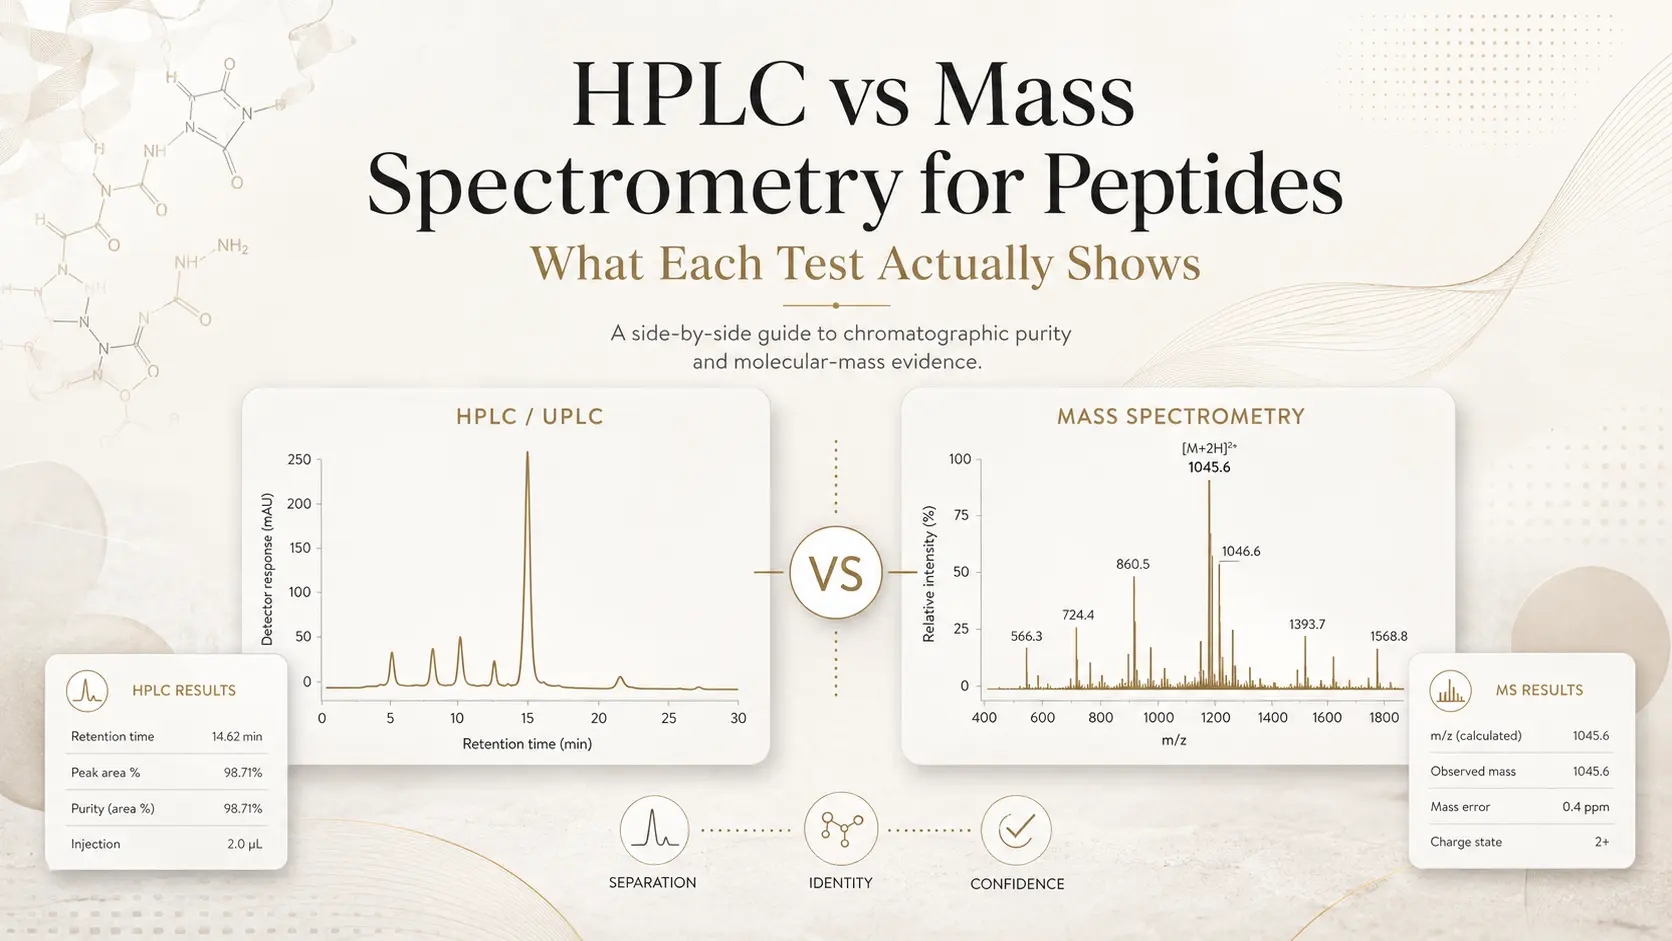
HPLC or UPLC separates the detectable components in a sample under a defined method. Mass spectrometry evaluates ions by their mass-to-charge ratio. Read together, the results can provide complementary evidence about chromatographic purity and molecular mass. Neither test, on its own, proves every aspect of a peptide material’s identity, content, sterility or suitability.
The useful question is not “Which test is better?” It is: what was this method designed to measure, and does the report support the claim being made?
Research-use boundary: This guide concerns analytical documentation for laboratory evaluation. It does not establish suitability for human use and does not provide dosing, administration or clinical guidance.
The quick comparison
| Question | HPLC or UPLC with UV detection | Mass spectrometry |
|---|---|---|
| What does the method do? | Separates sample components and records detector response over time | Measures ions by mass-to-charge ratio, written as m/z |
| What is commonly reported? | Retention time, chromatogram, peak areas and relative area percentage | Expected mass, observed mass or m/z signals, charge states and possible adducts |
| What can it support? | The sample’s chromatographic profile and relative purity under the stated method | Whether an observed species has molecular-mass evidence consistent with the expected compound |
| What does it not establish alone? | Definitive identity, absolute peptide content, fill quantity, sterility or endotoxin status | Chromatographic purity, absolute quantity, sterility, endotoxin status or complete structural identity |
| What makes the result useful? | Batch match, stated conditions, interpretable chromatogram, integration table and acceptance criterion | Batch match, expected-versus-observed comparison, interpretable spectrum and documented ion assignment |
The wording matters. “HPLC purity” is more precise than simply “purity.” “Mass consistent with the expected compound” is more defensible than treating one mass signal as complete identity confirmation.
What HPLC and UPLC show
High-performance liquid chromatography separates components as a sample moves through a column. Ultra-performance liquid chromatography, commonly abbreviated UPLC, applies the same core separation principle with equipment and particle sizes designed for higher pressure and potentially faster or higher-resolution methods.
The chromatograph is the separation system. It still needs a detector. Peptide reports commonly pair liquid chromatography with ultraviolet detection, often written as HPLC-UV or UPLC-UV. The detector records a signal as compounds leave the column, producing peaks at particular retention times.
The designated main peak is often reported as a percentage of the total integrated peak area. That result is a relative detector-response measurement under the stated conditions. It can show that one detected component dominates the chromatogram, but it should not be silently converted into a statement that the same percentage of the vial’s total mass is peptide.
Water, counterions, residual solvents, non-UV-active components and substances that are not resolved or detected by the chosen procedure can complicate that conversion. A 99% area result therefore does not automatically mean 99% net peptide content, 99% of labeled fill weight or 99% potency.
The method controls what the chromatogram can reveal. Column chemistry, mobile phases, gradient, flow rate, temperature, detector wavelength, sample preparation and integration settings can all affect separation and reported peak areas. FDA’s Q14 guidance emphasizes scientifically justified, fit-for-purpose analytical procedures rather than treating a result as independent of its method.1
What to check on a chromatographic report
Look for:
- the compound and batch or sample identifier;
- whether the report says HPLC or UPLC and identifies the detector;
- method conditions or a referenced method;
- a legible chromatogram;
- retention time and an integration table;
- the reported main-peak area percentage;
- an acceptance criterion, where one has been established; and
- secondary peaks that are unusually large, unexplained or excluded from integration.
A retention time can support comparison with a suitable reference under the same conditions. It is not, by itself, definitive proof that the main peak is the expected peptide. Co-elution and method-specific behavior are among the reasons orthogonal evidence matters.
What mass spectrometry adds
Mass spectrometry measures ions, not neutral molecules directly. The instrument separates or detects those ions according to their mass-to-charge ratio. Because a peptide may carry more than one charge, the spectrum can contain multiple m/z signals that represent the same molecular species at different charge states.
Other signals may reflect common adducts or related forms, depending on sample preparation and ionization. That is why an unlabeled spectrum is weaker than a report that states the expected mass, shows the observed signal and explains the assignment.
When the observed result agrees with a scientifically justified expected mass, it supports the conclusion that the analyzed species has a molecular mass consistent with the expected compound. This is valuable identity evidence, but it is not the whole identity question.
Two compounds can share the same nominal or exact mass while differing in sequence arrangement, stereochemistry or another structural feature. Tandem mass spectrometry, reference standards, retention-time comparison or other orthogonal methods may be needed when the analytical question requires that level of discrimination. A published LC-MS spiking method for endogenous peptide stereochemistry illustrates why stereochemical questions require purpose-built comparisons rather than a simple mass match.2
What to check on a mass report
Look for:
- the compound and batch or sample identifier;
- the expected neutral molecular mass or justified target value;
- the observed mass or m/z signal;
- the stated charge state, adduct or deconvolution where relevant;
- the mass tolerance or acceptance criterion, if defined;
- the type of MS analysis and enough method context to interpret it; and
- an authorized conclusion that matches the displayed data.
If a PDF contains only an image of a spectrum with no expected-versus-observed comparison, call it a mass spectrum or MS report. Do not upgrade it to “mass confirmation” until the assignment is explicit and reviewable.
Why the tests are complementary
Chromatography and mass spectrometry are often coupled because separation and mass evidence solve different parts of the analytical problem.
An HPLC-UV chromatogram may show a dominant main peak and several smaller peaks. Without suitable identity evidence, the chromatogram does not establish what that main peak is. Conversely, a mass spectrum may show a signal consistent with the expected molecular mass while saying little about how much of the UV-detectable sample is represented by other components.
Peptide assay recommendations published in Clinical Chemistry distinguish chromatographic purity, typically assessed by LC-UV, from mass identity and sequence-related evaluation by MS or LC-MS/MS. They also distinguish both from net peptide content.3 A separate multi-organization report on synthetic peptide reference standards describes identity, purity and strength as quality attributes supported by multiple techniques rather than one universal result.4
The strongest defensible summary is therefore layered:
- The chromatogram addresses separation and relative detector response.
- The mass result addresses molecular-mass consistency.
- The batch identifiers connect those results to the material under review.
- Other tests address other attributes.
That last point prevents overclaiming. Neither a high HPLC area percentage nor a matching mass establishes sterility, endotoxin level, residual solvent limits, water content, net peptide content, filled quantity, stability or suitability for a particular laboratory application.
A practical way to read both reports
Use this sequence when a product page provides chromatographic and mass documentation:
- Match the material. Confirm the compound name, supplied form and identifying code where relevant.
- Match the batch. Compare the label or batch listing with every analytical report. A result from another lot is historical information, not evidence for the current lot.
- Read the HPLC or UPLC method. Identify the detector, conditions, main peak, integration table, result and limit.
- Read the MS assignment. Compare the expected value with the observed result and check how charge states or adducts were interpreted.
- Compare the scope of the claims. “HPLC area purity” and “mass consistent with expected” are separate statements. Neither should be broadened into an unsupported quality guarantee.
- Check the dates and issuer. Confirm the chronology makes sense and the report identifies the responsible laboratory or manufacturer.
- Record unresolved discrepancies. Missing batch links, unexplained peaks, conflicting identifiers or ambiguous assignments should be clarified before reliance.
For the full document-level workflow—including acceptance limits, authorization and endotoxin reporting—use the companion guide, How to Read a Peptide COA.
Red flags worth pausing over
Investigate further when you see:
- a headline purity percentage without a chromatogram or integration table;
- “99% pure” presented without naming the method;
- a mass spectrum with no expected mass or interpreted observed value;
- a batch number that changes between the product page, chromatogram and mass report;
- a report date that predates sample receipt without an explanation;
- excluded peaks or cropped axes that are not documented;
- “identity confirmed” based only on retention time;
- “purity confirmed by MS” without a validated quantitative method and explanation;
- one test result used to imply sterility, endotoxin status or absolute fill quantity; or
- a polished testing badge that cannot be traced to a report and issuer.
No single red flag automatically proves a material is unacceptable. It means the documentation does not yet support a clean conclusion.
The bottom line
HPLC or UPLC and mass spectrometry are not competing versions of the same test.
Chromatography can describe the relative profile of detectable components under a defined separation method. Mass spectrometry can provide evidence that an observed species has a molecular mass consistent with the expected peptide. The two results become more useful when they are batch-matched, method-specific and interpreted within their limits.
Do not ask one number to answer every quality question. Check the batch, identify the method, read the actual result and keep each conclusion no broader than the evidence.
Sources
- U.S. Food and Drug Administration, Q14 Analytical Procedure Development, final guidance, March 2024.
- Yussif BM and Checco JW, Evaluation of Endogenous Peptide Stereochemistry Using Liquid Chromatography-Mass Spectrometry-Based Spiking Experiments, Methods in Enzymology, 2022.
- Hoofnagle AN, et al., Recommendations for the Generation, Quantification, Storage, and Handling of Peptides Used for Mass Spectrometry-Based Assays, Clinical Chemistry, 2016.
- McCarthy D, et al., Reference Standards to Support Quality of Synthetic Peptide Therapeutics, Pharmaceutical Research, 2023.