
For laboratory research only. Not for human or animal use. This article gives no dosing, administration or therapeutic advice.
Short answer: HPLC (or its faster sibling UPLC) separates a peptide sample into its components and reports how large the main peak is relative to everything else; that is the “purity” percentage. Mass spectrometry measures the mass-to-charge ratio of what comes off the column and reports whether the main peak’s mass matches the intended molecule; that is identity evidence. A research-peptide certificate that shows both is answering two different questions, “how clean?” and “is it the right molecule?”, and neither instrument can answer the other’s question.
This guide explains what each technique measures, where each is blind, what HPLC-MS and MS/MS add, and how to read the two panels on the UPLC-MS reports in the Purity Collective COA library. For the full field-by-field walk-through of a certificate, see how to read a peptide COA.
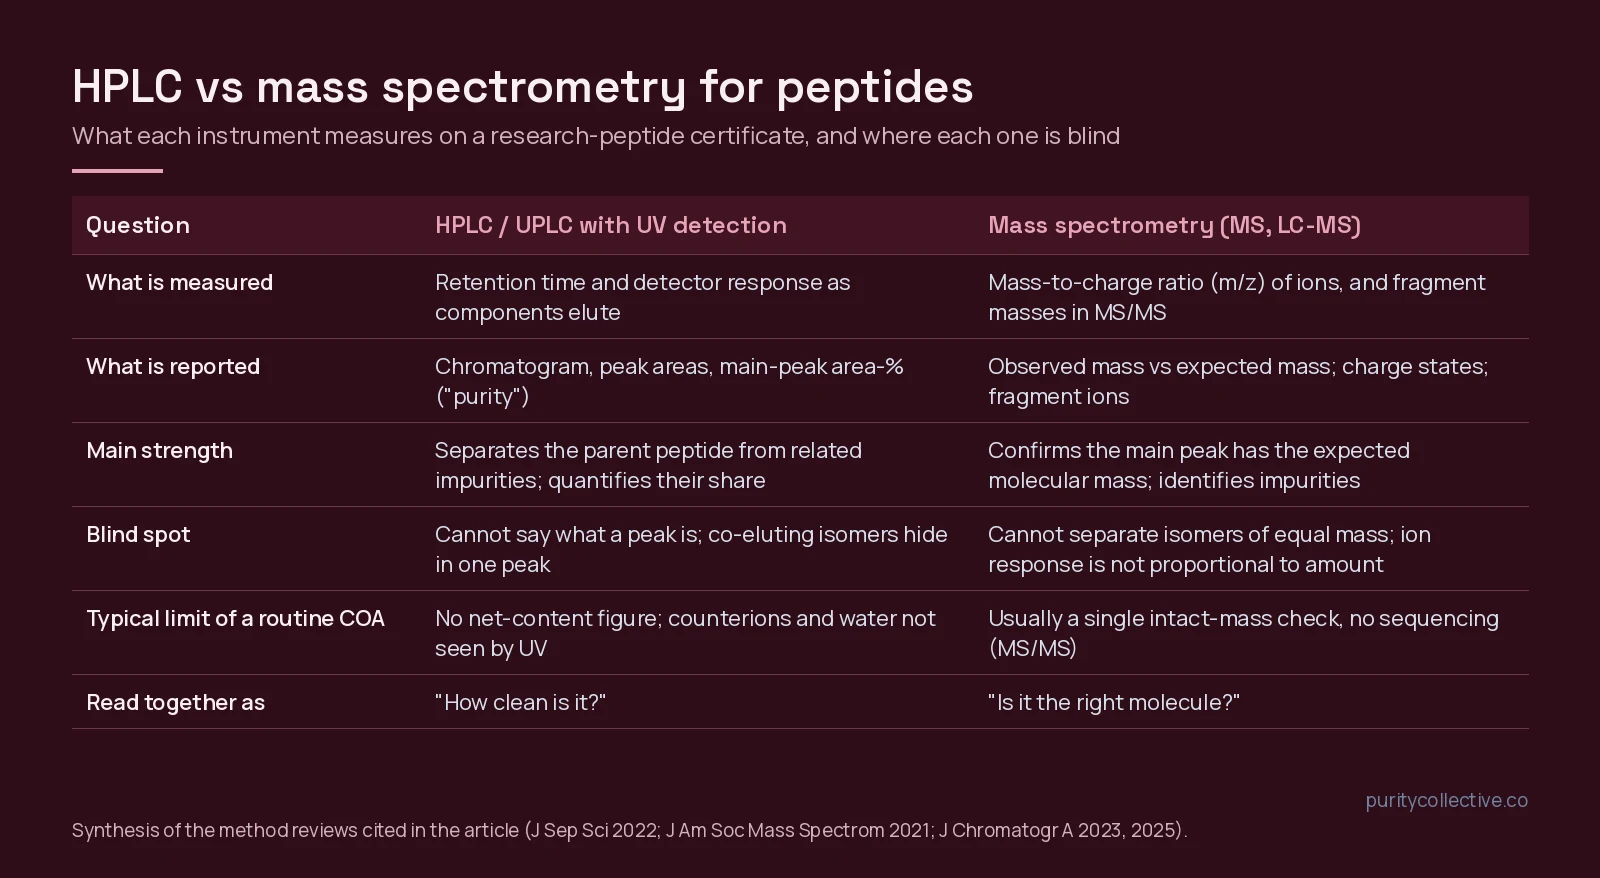
HPLC vs mass spectrometry at a glance
| Question | HPLC / UPLC with UV detection | Mass spectrometry (MS, LC-MS) |
|---|---|---|
| What is measured | Retention time and detector response as components elute from a column | Mass-to-charge ratio (m/z) of ions; fragment masses in MS/MS |
| What is reported | Chromatogram, peak areas, main-peak area-% (“purity”) | Observed mass vs expected mass; charge states; fragment ions |
| Main strength | Separates the parent peptide from related impurities and quantifies their share[1] | Confirms the main peak has the expected mass; identifies and characterizes impurities[2] |
| Blind spot | Cannot say what a peak is; co-eluting isomers hide inside one peak[7] | Cannot separate isomers of equal mass; ion response is not proportional to amount[7][9] |
| Routine COA limit | No net-content figure; counterions and water are invisible to UV | Usually an intact-mass check only, no sequencing |
| Read together as | “How clean is it?” | “Is it the right molecule?” |
What HPLC actually measures
High-performance liquid chromatography pushes a dissolved sample through a packed column with a solvent gradient. For peptides the column is almost always reversed-phase (a hydrophobic C18 or C8 surface), and components elute in order of hydrophobicity: more hydrophobic sequences stick longer and come off later. That relationship is regular enough that retention times can be predicted from amino-acid composition, and side-chain hydrophobicity scales have been built directly from reversed-phase retention of model peptides[4][3]. A UV detector records absorbance as material passes, and the result is a chromatogram: signal against time.
Purity on a certificate is the area of the main peak divided by the total area of all integrated peaks, as a percentage. On the Tesamorelin 10mg report for lot PCCL-4867057-P that figure is 99.23%; on the four component panels of the KLOW 80mg report it runs from 99.05% to 99.45%. Reviews of pharmaceutical peptide characterization describe reversed-phase HPLC with UV detection as the primary purity method precisely because synthetic-process impurities (deletion and truncation sequences, oxidized or deamidated variants, protecting-group adducts) differ in hydrophobicity from the parent and separate from it[1][2].
What HPLC cannot do is name a peak. A detector sees absorbance, not structure. If two molecules co-elute, the chromatogram shows one peak and the area-% overstates purity. A 2023 two-dimensional LC-MS study screened 30 column and mobile-phase combinations specifically to resolve peptide isomers, because compounds with the same mass cannot be told apart by the mass spectrometer and must be separated chromatographically[7], and a 2025 study of synthetic cyclic peptides found reversed-phase alone gave inaccurate impurity totals until an orthogonal HILIC separation was added[8]. A routine certificate uses one column and one gradient; read its purity figure as a screening value under that method, not as an absolute.
Reading peak areas and the integration table
The area-% figure rests on an assumption that is easy to miss: that every integrated peak absorbs UV light about as strongly, per molecule, as the main peptide. At the 210 to 220 nm wavelengths used for peptides, most of the signal comes from the peptide bond, but some side chains add far more. Measured at 214 nm, tryptophan absorbs roughly 30 times more than a peptide bond, and phenylalanine, tyrosine and histidine about six times more[13]. An impurity that has lost an aromatic residue therefore draws a smaller peak than its true share, and one that carries an extra aromatic group draws a larger one. Characterization reviews treat area-% as a relative profile for exactly this reason[1][2].
The integration table beside the chromatogram is where that profile is built. Read it for three things:
- How many peaks were counted. A table that lists the main peak and several small ones, each with a retention time and area, shows its work. A single line reading 99.2% with no other peaks listed says less than it seems to.
- The reporting threshold. Peaks below a set size are usually left out of the total. A low threshold counts more small impurities and gives a more conservative purity; a high one hides them.
- The baseline. Where the software draws the baseline under a broad or tailing peak changes its area. A shoulder on the main peak, as noted below, may be a co-eluting impurity that was integrated as part of it.
None of this turns area-% into a quantity. The milligram figure on a report is a separate measurement against a label or a reference standard; our guide to listed quantity vs analytical result explains why the two belong in separate columns.
HPLC vs UPLC
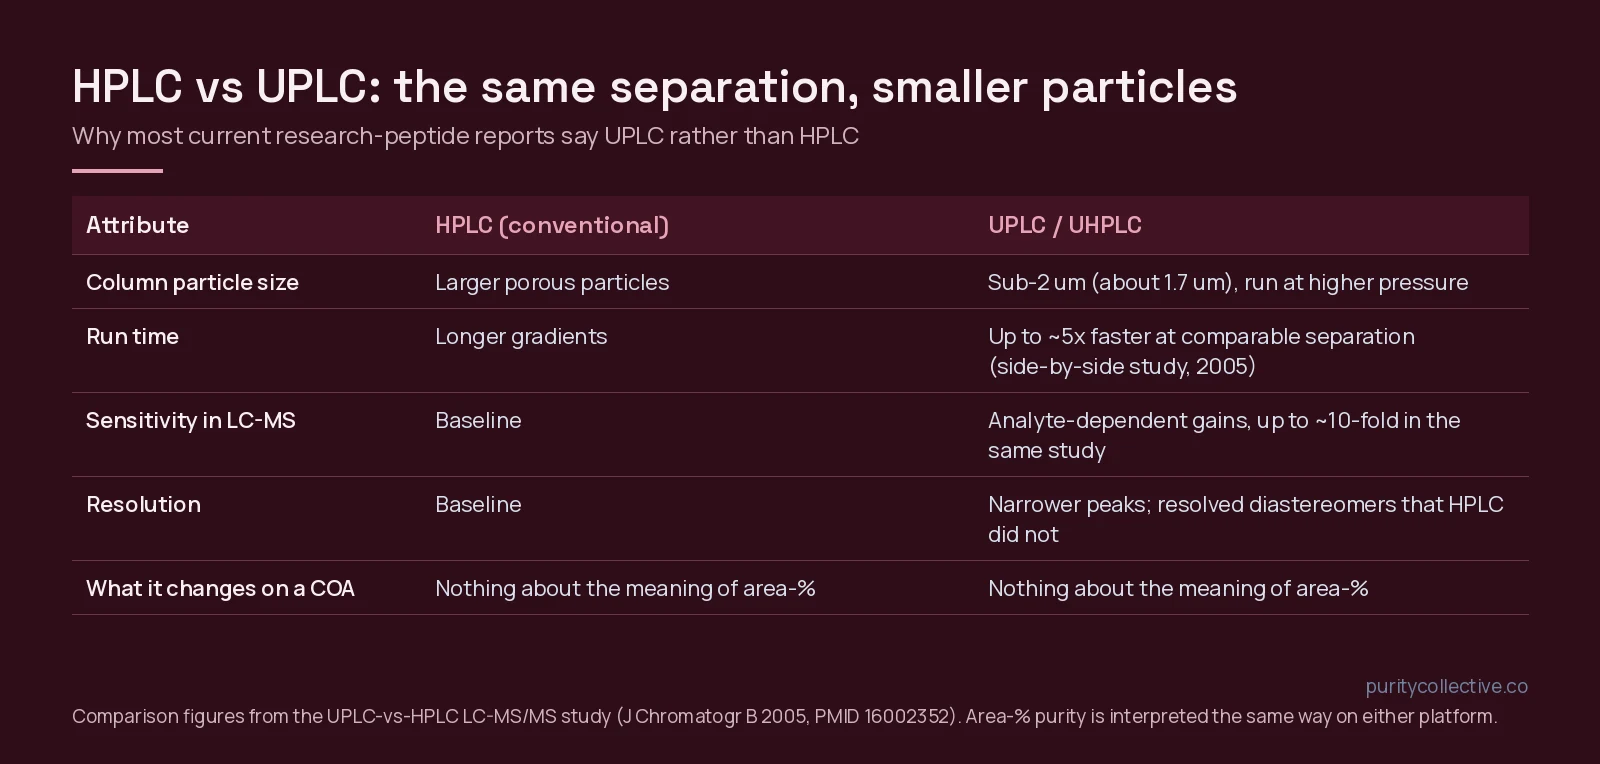
Most current research-peptide reports, including ours, say UPLC rather than HPLC. Ultra-performance liquid chromatography is the same reversed-phase separation run on columns packed with about 1.7 µm particles, which need much higher pressure. In the side-by-side LC-MS/MS comparison that introduced the approach, UPLC gave analyte-dependent sensitivity gains of up to ten-fold, run-time reductions of up to five-fold at comparable separation, narrower peaks, and a separation of diastereomers that the HPLC method could not achieve[5]. The practical reading rule: UPLC on a certificate means a faster, usually sharper chromatogram. It does not change what area-% means or add information about identity or content.
What mass spectrometry actually measures
A mass spectrometer converts molecules into gas-phase ions and sorts them by mass-to-charge ratio. For peptides the ion source is nearly always electrospray ionization (ESI), which sprays the column eluent through a charged needle and produces intact, often multiply charged peptide ions with no upper mass limit[6]. The instrument reports the m/z values it observes; software converts the charge-state series back to a neutral mass. A COA mass panel then compares that observed mass with the calculated mass of the intended sequence: about 5196 g/mol for tesamorelin, about 1419.5 for BPC-157, about 4963 for TB-500, as printed on our reports.
A match is identity evidence of a specific kind. It rules out a wrong compound of a different mass, which is the most consequential mix-up a buyer can face. It does not rule out an isomer (same atoms, different arrangement, same mass), and on a routine report it does not sequence the peptide. Sequencing needs tandem MS (MS/MS), in which the parent ion is fragmented and the fragment masses are read back as a sequence ladder[11]. Top-down and MS/MS methods on high-resolution instruments can resolve site-specific heterogeneity in peptide drugs that HPLC alone cannot separate[10], but that level of work appears in characterization studies, not on a lot certificate.
Nor is a mass spectrum a purity measurement. Ionization efficiency differs between molecules, so the relative heights of peaks in a spectrum are not proportional to their amounts. Metrology laboratories that assign purity to peptide reference materials do use LC-high-resolution MS, but with impurity-by-impurity calibration: one study identified and quantified more than 65 structurally related impurities in a synthetic C-peptide to correct its purity value[9], and a similar approach was needed for oxytocin because of its disulfide bond[12]. That is the opposite end of the effort scale from a one-page COA.
What “mass consistent with expected” means
The phrase means the observed mass of the main peak agrees with the mass calculated from the intended sequence, within the instrument’s tolerance. Three details decide how much it tells you.
- Which mass. The expected value can be the average mass (the molecular weight printed in an identity block, about 5195.8 for tesamorelin, C223H370N72O69S) or the monoisotopic mass (the mass with only the lightest isotopes, about 5192.7 for the same formula). For a 5 kDa peptide the two differ by about 3 Da, so a report has to compare like with like.
- How close. Agreement is stated as a difference in daltons or in parts per million. The terminology for accurate mass, and the statistics for deciding whether a measured value supports a structure, are set out in a widely cited guide for mass spectrometry users[14]. High-resolution analyzers such as the Orbitrap made low-ppm accuracy routine in many labs[15]; a routine certificate will often use a lower-resolution instrument with a wider tolerance.
- What is printed. A useful mass panel shows the expected value, the observed value and the ions used to reach it (for electrospray, a series of multiply charged ions[6]). A bare “consistent with expected” without numbers is a weaker statement, because you cannot check it.
A match supports identity and nothing else. It does not separate isomers of the same mass, it does not measure purity or quantity, and it does not speak to endotoxin or sterility.
HPLC-MS, LC-MS and MS/MS: what the hyphen adds
When searchers type “HPLC MS” or “HPLC mass spec” they usually mean the coupled instrument: the chromatograph’s outlet feeds the mass spectrometer, so every eluting peak is measured by both UV and m/z. This is the configuration behind the “UPLC with mass spectrometry” line on our certificates. The combination is more informative than either half because the separation tells you how many components there are and the mass spectrometer tells you what each one weighs; impurity characterization in synthetic peptide manufacturing is built on exactly this pairing[2]. Three variants you will meet:
- LC-MS / HPLC-MS / UPLC-MS: separation plus intact-mass measurement of each peak. This is what a routine research-peptide COA shows.
- LC-MS/MS (tandem): adds fragmentation of selected ions, used for sequence confirmation and for quantifying specific impurities[11][9].
- 2D-LC-MS: two orthogonal separations before the mass spectrometer, used when isomers co-elute in one dimension[7].
Reading the two panels on a Purity Collective report
Our UPLC-MS certificates print a specification-and-result block followed by a UPLC chromatogram and an MS panel. Read them in this order:
- Specification vs result. Purity specification (printed as ≥98% or >98%) against the measured area-%; labeled quantity against measured quantity (10mg vs 10.13mg on the tesamorelin lot). Quantity is a separate measurement from purity; see product quantity vs analytical result.
- The chromatogram. One dominant peak, a flat baseline, and small late- or early-eluting impurity peaks is what a clean synthetic peptide looks like. A shoulder on the main peak is worth a question.
- The mass panel. Confirm the observed mass sits at the expected value for the compound named in the identity block. Then check that identity block against PubChem; one of our own reports (KLOW lot PCCL-7964352) prints a KPV identifier block that does not correspond to KPV, and a corrected report has been requested from the lab. The spectrum is only as useful as the identity it is being compared with.
- What is absent. No net peptide content, no counterion assay, no sequencing, no sterility. Our article on what 99% purity means covers the first two gaps, and purity vs endotoxin reports covers why the endotoxin document is separate.
Method labels on peptide reports: a short glossary
Reports from different labs use different shorthand for the same ideas. These are the labels you will meet on research-peptide documents, including ours.
| Label | What it means | What it answers |
|---|---|---|
| RP-HPLC | Reversed-phase high-performance liquid chromatography | How many components, and the main peak’s share (area-%) |
| UPLC | The same separation on sub-2 µm particles | Same as HPLC, with sharper peaks |
| UV 214 / 220 nm | Detection wavelength for the chromatogram | Which absorbance the area-% is based on |
| Retention time (RT) | When a peak leaves the column | Position in the chromatogram; not identity by itself |
| HPLC-RTM | Retention-time match against a reference standard | Identity by co-elution (the ILS report for Tesamorelin 20mg uses it) |
| ESI | Electrospray ionization | How peptides become ions for MS |
| m/z | Mass-to-charge ratio | The raw MS reading before charge deconvolution |
| LC-MS / UPLC-MS | Chromatography coupled to a mass spectrometer | Separation plus the mass of each peak |
| LC-MS/MS | Tandem MS with fragmentation | Sequence-level identity, specific impurities |
| MALDI-MS | Matrix-assisted laser desorption ionization MS | Intact mass, often without a separation step |
| HRMS | High-resolution mass spectrometry | Mass to within a few ppm |
Before relying on any of these results, ask three scope questions. Which sample was measured: this lot, this strength, or one component panel of a blend? What can the method detect, and what can it not? Which limits were printed: a specification, a reporting threshold, a detection limit? A result is only as wide as the answers. A report should never be read more broadly than its own method and sample allow.
What neither test shows
- Net peptide content: the mass fraction of the powder that is peptide, after water and counterions. Area-% is not this.
- Stability after the analysis date.
- Sterility or endotoxin; those are separate tests.
- Anything about another lot, strength or format of the same compound.
- Suitability for a given protocol.
When you compare documentation across sellers before you buy research peptides online in the USA, look for both panels on the same lot, a stated method, a printed specification and a chromatogram you can see. Reports that give only a percentage with no chromatogram, or only a mass spectrum with no separation, are each answering half the question.
Frequently asked questions
Is HPLC or mass spectrometry better for checking a peptide?
Neither replaces the other. HPLC (or UPLC) with UV detection separates the peptide from related impurities and gives the area-% purity figure; mass spectrometry confirms that the main peak has the expected molecular mass. A certificate that shows both answers two different questions; one that shows only one leaves the other open.
What does HPLC-MS or LC-MS mean on a COA?
That the chromatograph’s outlet was connected to a mass spectrometer, so each eluting peak was also measured by mass-to-charge ratio. HPLC-MS/MS or LC-MS/MS adds a fragmentation step that can confirm sequence. Most routine research-peptide reports show an intact-mass spectrum, not MS/MS.
Why do some certificates say UPLC instead of HPLC?
UPLC (ultra-performance liquid chromatography) runs the same reversed-phase separation on sub-2 µm particles at higher pressure, which gives narrower peaks and shorter run times. It does not change what the area-% purity number means.
Can mass spectrometry measure purity?
Not on its own in a routine report. Ion response differs between molecules, so peak heights in a mass spectrum are not proportional to amount. Reference-material laboratories quantify impurities by LC-high-resolution MS with calibration, which is far more work than a routine COA includes.
What does “mass consistent with expected” mean?
That the measured mass of the main peak matches the calculated mass of the intended peptide within the instrument’s tolerance. It supports identity, but it cannot distinguish isomers of the same mass and says nothing about how much of the sample is that molecule.
Why do the expected and observed masses on a report differ slightly?
Every instrument measures within a tolerance, and labs may quote average or monoisotopic mass. A small difference within the stated tolerance is normal. A difference of whole residues, or a comparison of average against monoisotopic mass, is worth a question to the seller.
What does HPLC-RTM mean on an identity line?
Retention-time match: the sample’s main peak eluted at the same time as a reference standard of the same compound under the same method. It is identity evidence by co-elution, which is weaker than a mass match because different molecules can share a retention time.
References
- Sharma N, Kukreja D, Giri T et al. (2022). Synthetic pharmaceutical peptides characterization by chromatography principles and method development. J Sep Sci. PMID: 35460196. doi: 10.1002/jssc.202101034.
- Lian Z, Wang N, Tian Y et al. (2021). Characterization of Synthetic Peptide Therapeutics Using Liquid Chromatography-Mass Spectrometry: Challenges, Solutions, Pitfalls, and Future Perspectives. J Am Soc Mass Spectrom. PMID: 34110145. doi: 10.1021/jasms.0c00479.
- Al Musaimi O, Valenzo OMM, Williams DR (2023). Prediction of peptides retention behavior in reversed-phase liquid chromatography based on their hydrophobicity. J Sep Sci. PMID: 36349538. doi: 10.1002/jssc.202200743.
- Mant CT, Kovacs JM, Kim HM et al. (2009). Intrinsic amino acid side-chain hydrophilicity/hydrophobicity coefficients determined by reversed-phase high-performance liquid chromatography of model peptides: comparison with other hydrophilicity/hydrophobicity scales. Biopolymers. PMID: 19795449. doi: 10.1002/bip.21316.
- Churchwell MI, Twaddle NC, Meeker LR et al. (2005). Improving LC-MS sensitivity through increases in chromatographic performance: comparisons of UPLC-ES/MS/MS to HPLC-ES/MS/MS. J Chromatogr B Analyt Technol Biomed Life Sci. PMID: 16002352. doi: 10.1016/j.jchromb.2005.05.037.
- Wilm M (2011). Principles of electrospray ionization. Mol Cell Proteomics. PMID: 21742801. doi: 10.1074/mcp.M111.009407.
- Petersson P, Buckenmaier S, Euerby MR et al. (2023). A strategy for assessing peak purity of pharmaceutical peptides in reversed-phase chromatography methods using two-dimensional liquid chromatography coupled to mass spectrometry. Part I: Selection of columns and mobile phases. J Chromatogr A. PMID: 36841023. doi: 10.1016/j.chroma.2023.463874.
- Yoshida K, Kato S, Nagai K et al. (2025). Impurity profiling of synthetic cyclic peptides based on orthogonality between hydrophilic-interaction and reversed-phase liquid chromatography. J Chromatogr A. PMID: 39922152. doi: 10.1016/j.chroma.2025.465748.
- Li M, Josephs RD, Daireaux A et al. (2018). Identification and accurate quantification of structurally related peptide impurities in synthetic human C-peptide by liquid chromatography-high resolution mass spectrometry. Anal Bioanal Chem. PMID: 29862433. doi: 10.1007/s00216-018-1155-y.
- Gucinski AC, Boyne MT 2nd (2014). Identification of site-specific heterogeneity in peptide drugs using intact mass spectrometry with electron transfer dissociation. Rapid Commun Mass Spectrom. PMID: 24975256. doi: 10.1002/rcm.6957.
- Medzihradszky KF, Chalkley RJ (2015). Lessons in de novo peptide sequencing by tandem mass spectrometry. Mass Spectrom Rev. PMID: 25667941. doi: 10.1002/mas.21406.
- Li M, Josephs RD, Daireaux A et al. (2021). Structurally related peptide impurity identification and accurate quantification for synthetic oxytocin by liquid chromatography-high-resolution mass spectrometry. Anal Bioanal Chem. PMID: 33479819. doi: 10.1007/s00216-021-03154-5.
- Kuipers BJ, Gruppen H (2007). Prediction of molar extinction coefficients of proteins and peptides using UV absorption of the constituent amino acids at 214 nm to enable quantitative reverse phase high-performance liquid chromatography-mass spectrometry analysis. J Agric Food Chem. PMID: 17539659. doi: 10.1021/jf070337l.
- Brenton AG, Godfrey AR (2010). Accurate mass measurement: terminology and treatment of data. J Am Soc Mass Spectrom. PMID: 20650651. doi: 10.1016/j.jasms.2010.06.006.
- Zubarev RA, Makarov A (2013). Orbitrap mass spectrometry. Anal Chem. PMID: 23590404. doi: 10.1021/ac4001223.